 |
 |
|
Filter Research |
Go back to HOMEPAGE
|
|
|
|
Filter Research |
Go back to HOMEPAGE
|
Planetary (Colour) Filter Research Probably the least explained but most common accessory in everyone’s case is colour filters. They are lauded by many for their ability to improve the contrast of certain features on the moon and the planets…but why? Why does one filter work better than another? Do I need 3 shades of red? Why are there no pinks? What’s the difference between violet and indigo? …
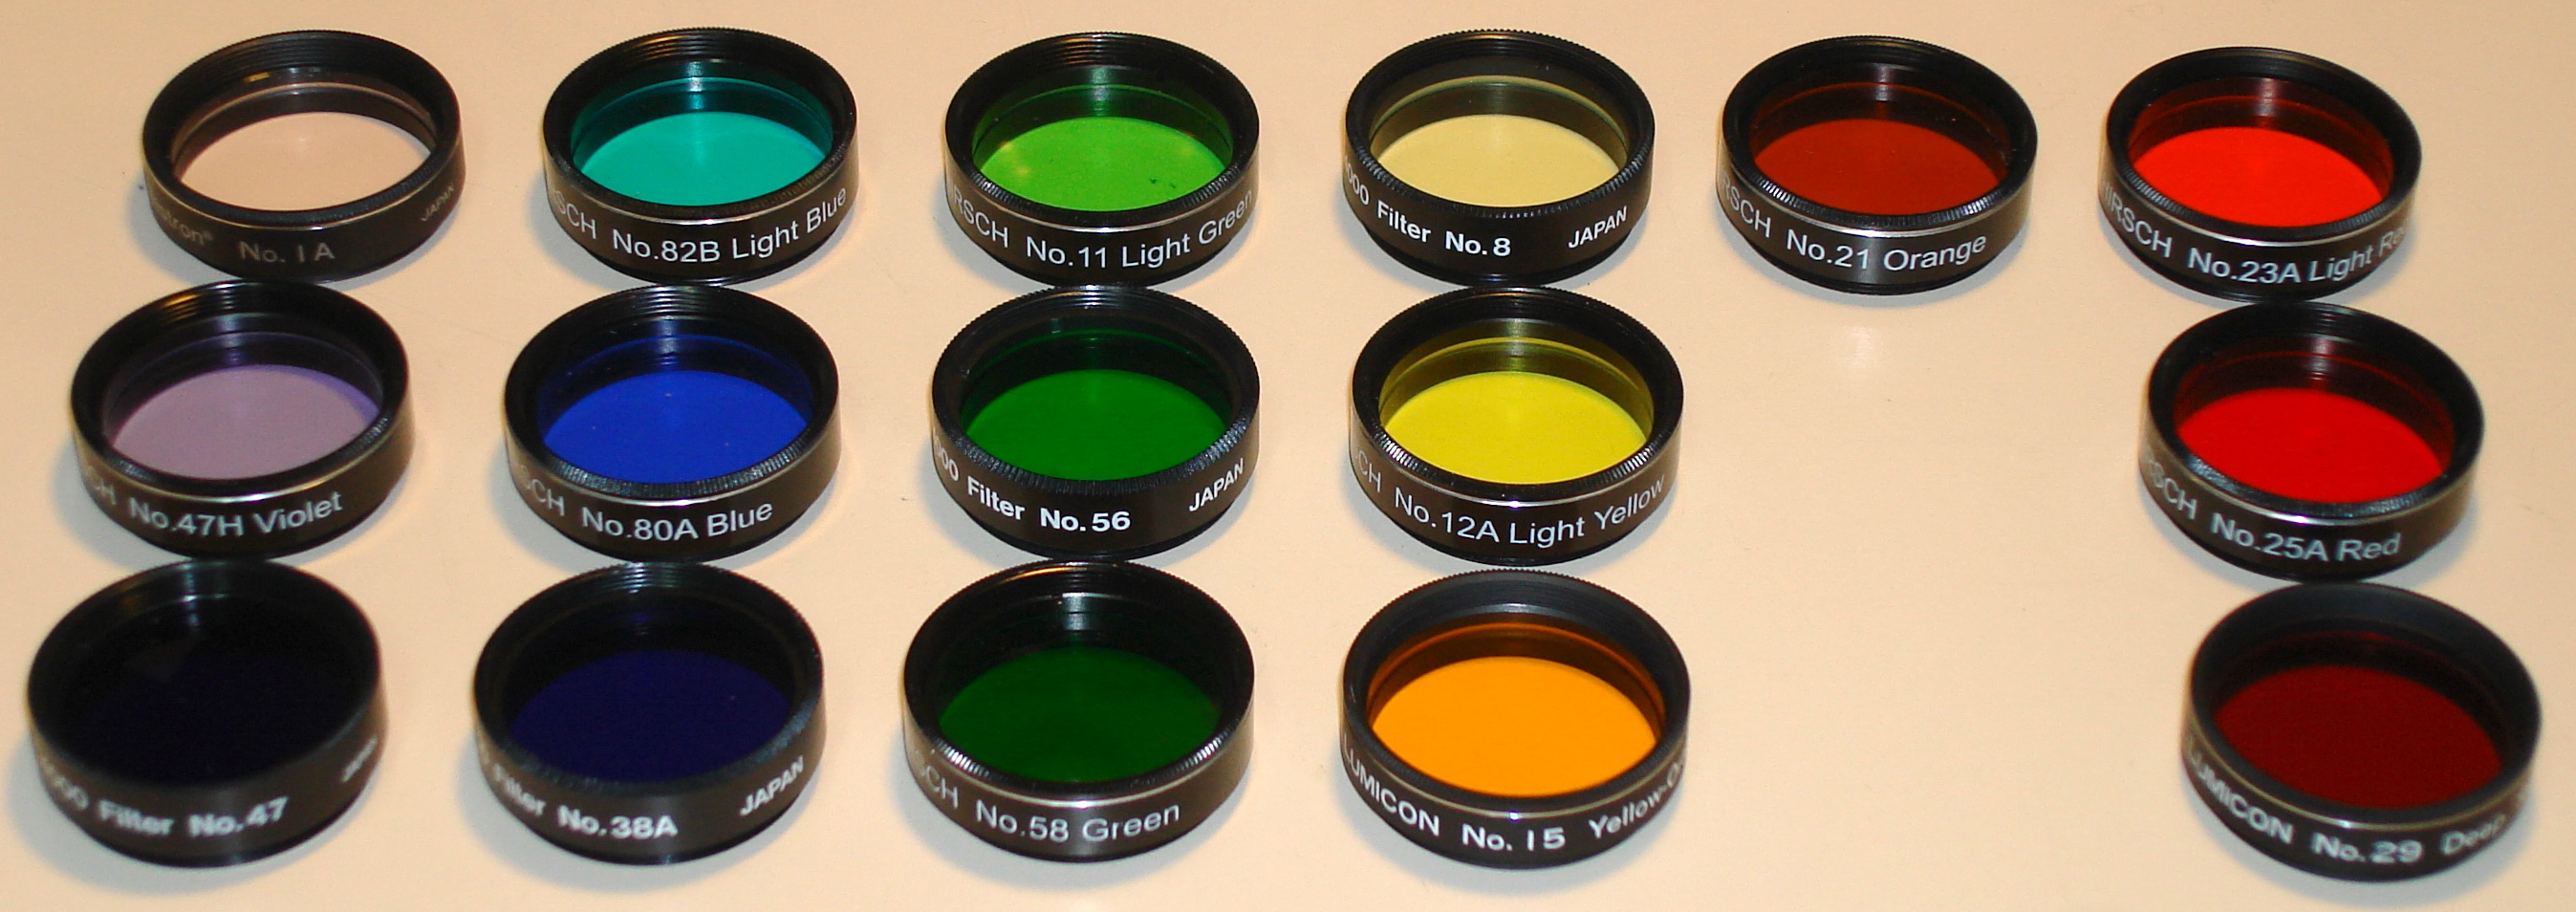
Figure 5 The Available Spectrum of Colour Astronomy Filters I’m a curious chap, and used to answering questions by first gathering all the data I can. So, working within the theme of my research I decided to put together a database of spectral response curves for commonly available colour filters. The problem of course was that nobody has that data. None of the manufacturers I researched have spectral response data for standard colour filters. Lucky for us colour filters for astronomy find their origin in terrestrial film photography. Some time ago Kodak established a colour filter standard called the Wratten #. The filter numbers we are used to seeing in astronomy are in fact these Wratten #’s from the original Kodak system. So, where does one find spectral data for Kodak Wratten filters? There was apparently a photography book published by Kodak that is out of print now, but I instead found the data in the “CRC Handbook of Chemistry & Physics, 1st Student Edition” which just happens to be sitting on my shelf at work. The data tables in the book also included the % transmissivity (photopic), a parameter that filter manufacturers do quote. You can download a PDF of the Wratten filter tables from the Reference chapter. I used the Kodak spectral response data to calculate my own % transmissivities, and compared that to the values quoted by different filter manufacturers. I noticed a lot of discrepancies: some filters obviously quoting other filters’ transmissivities (eg. green quoting transmissivity for dark green), other filters being just completely out-to-lunch. The out-to-lunch filters made me wonder; was the Wratten data not applicable to these filters, or was the manufacturer’s quoted transmissivity data wrong? The only way to know for sure was to have measured data from a reputable source, me.
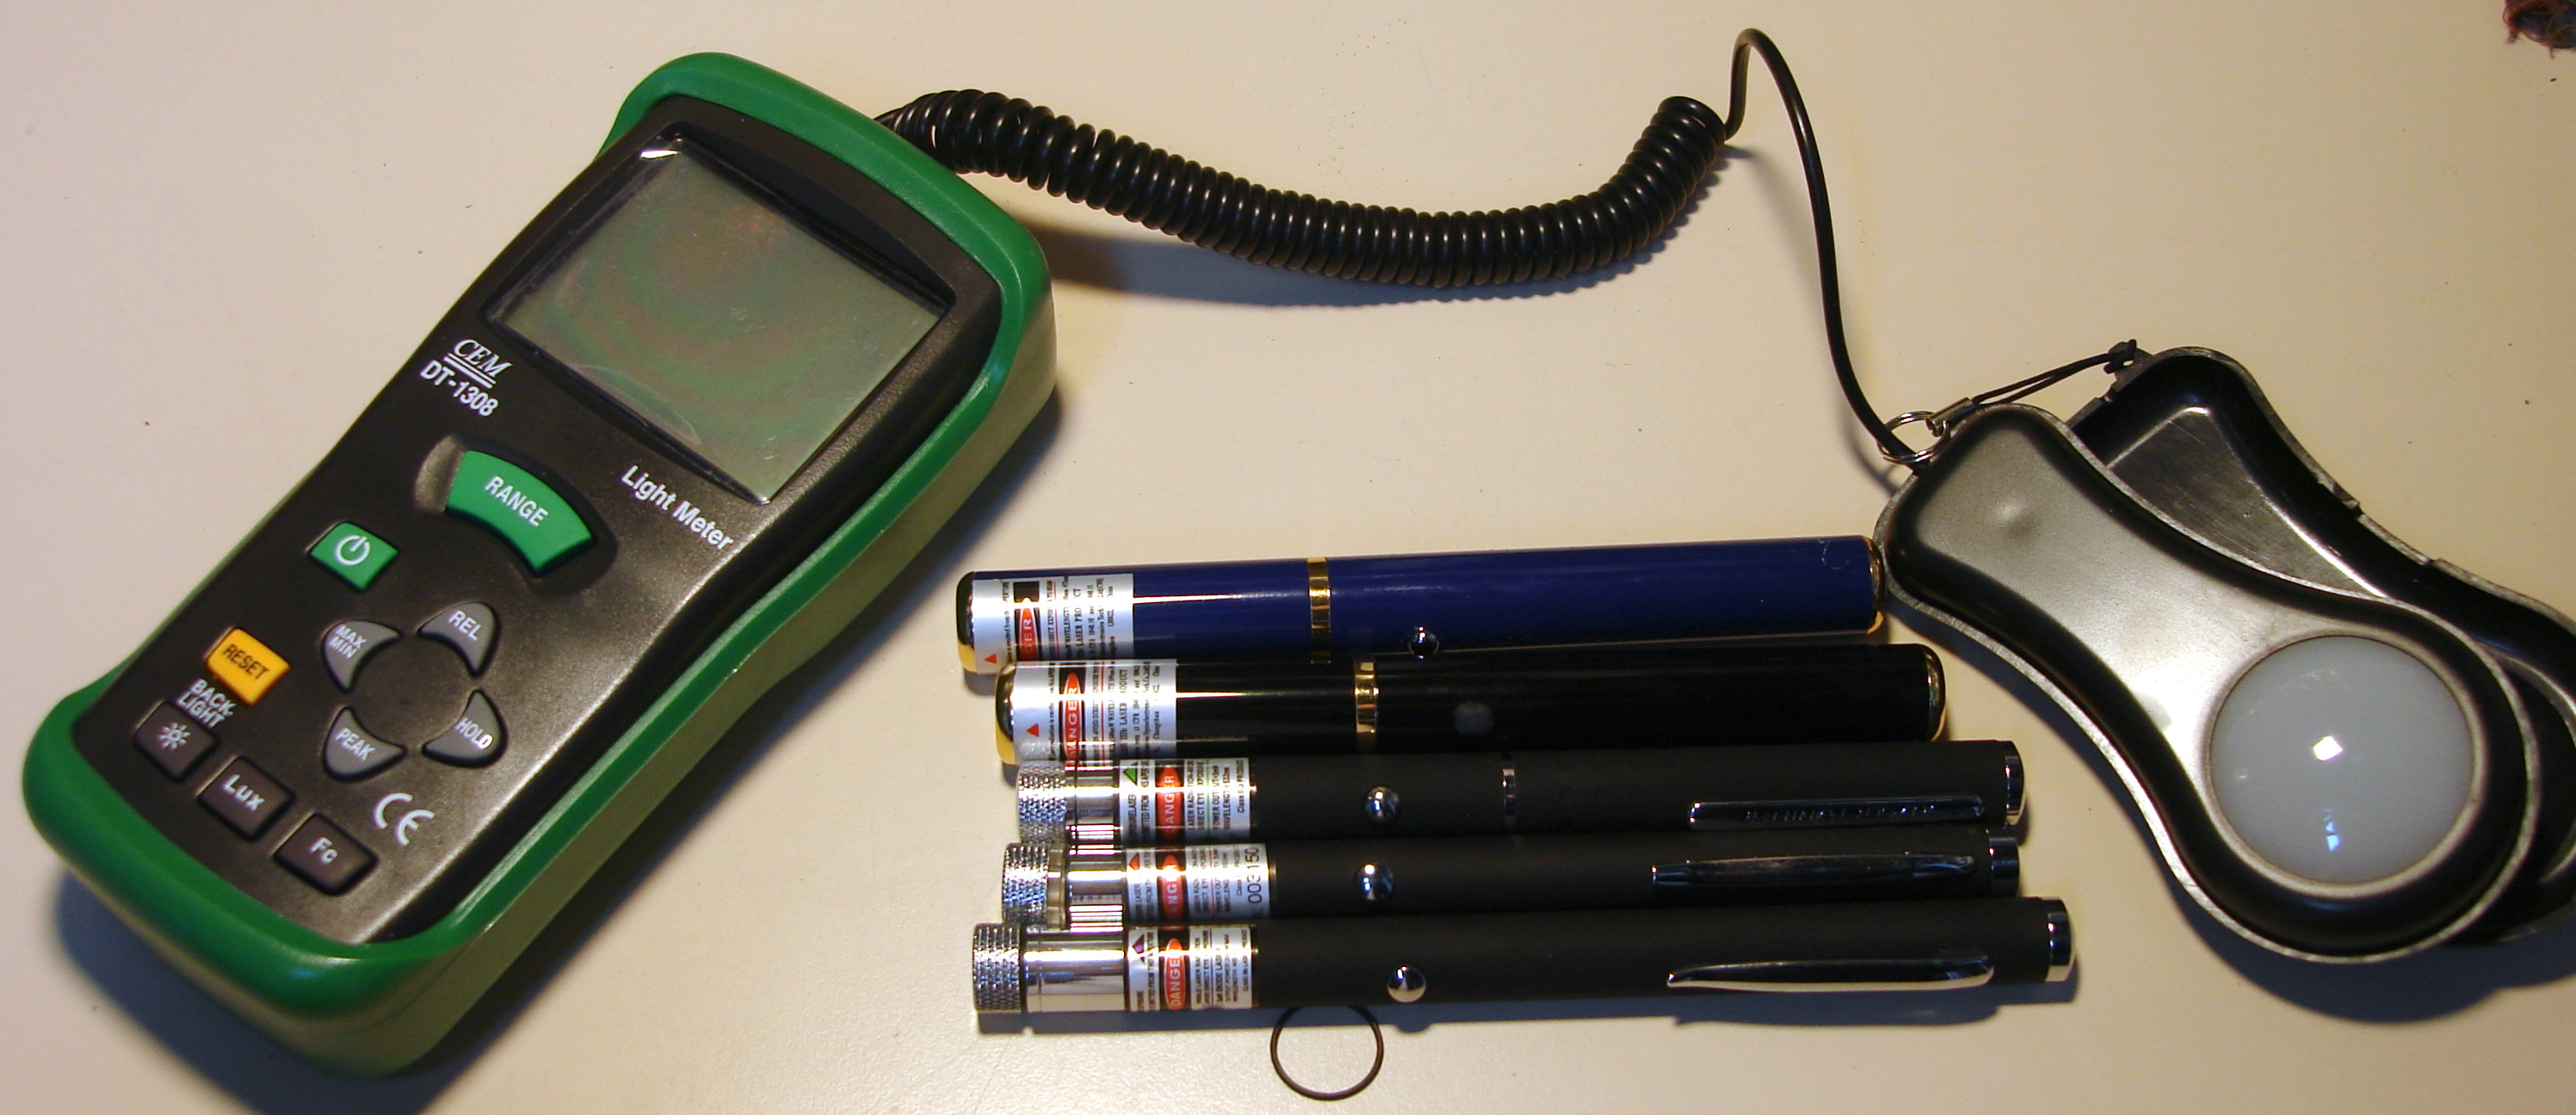
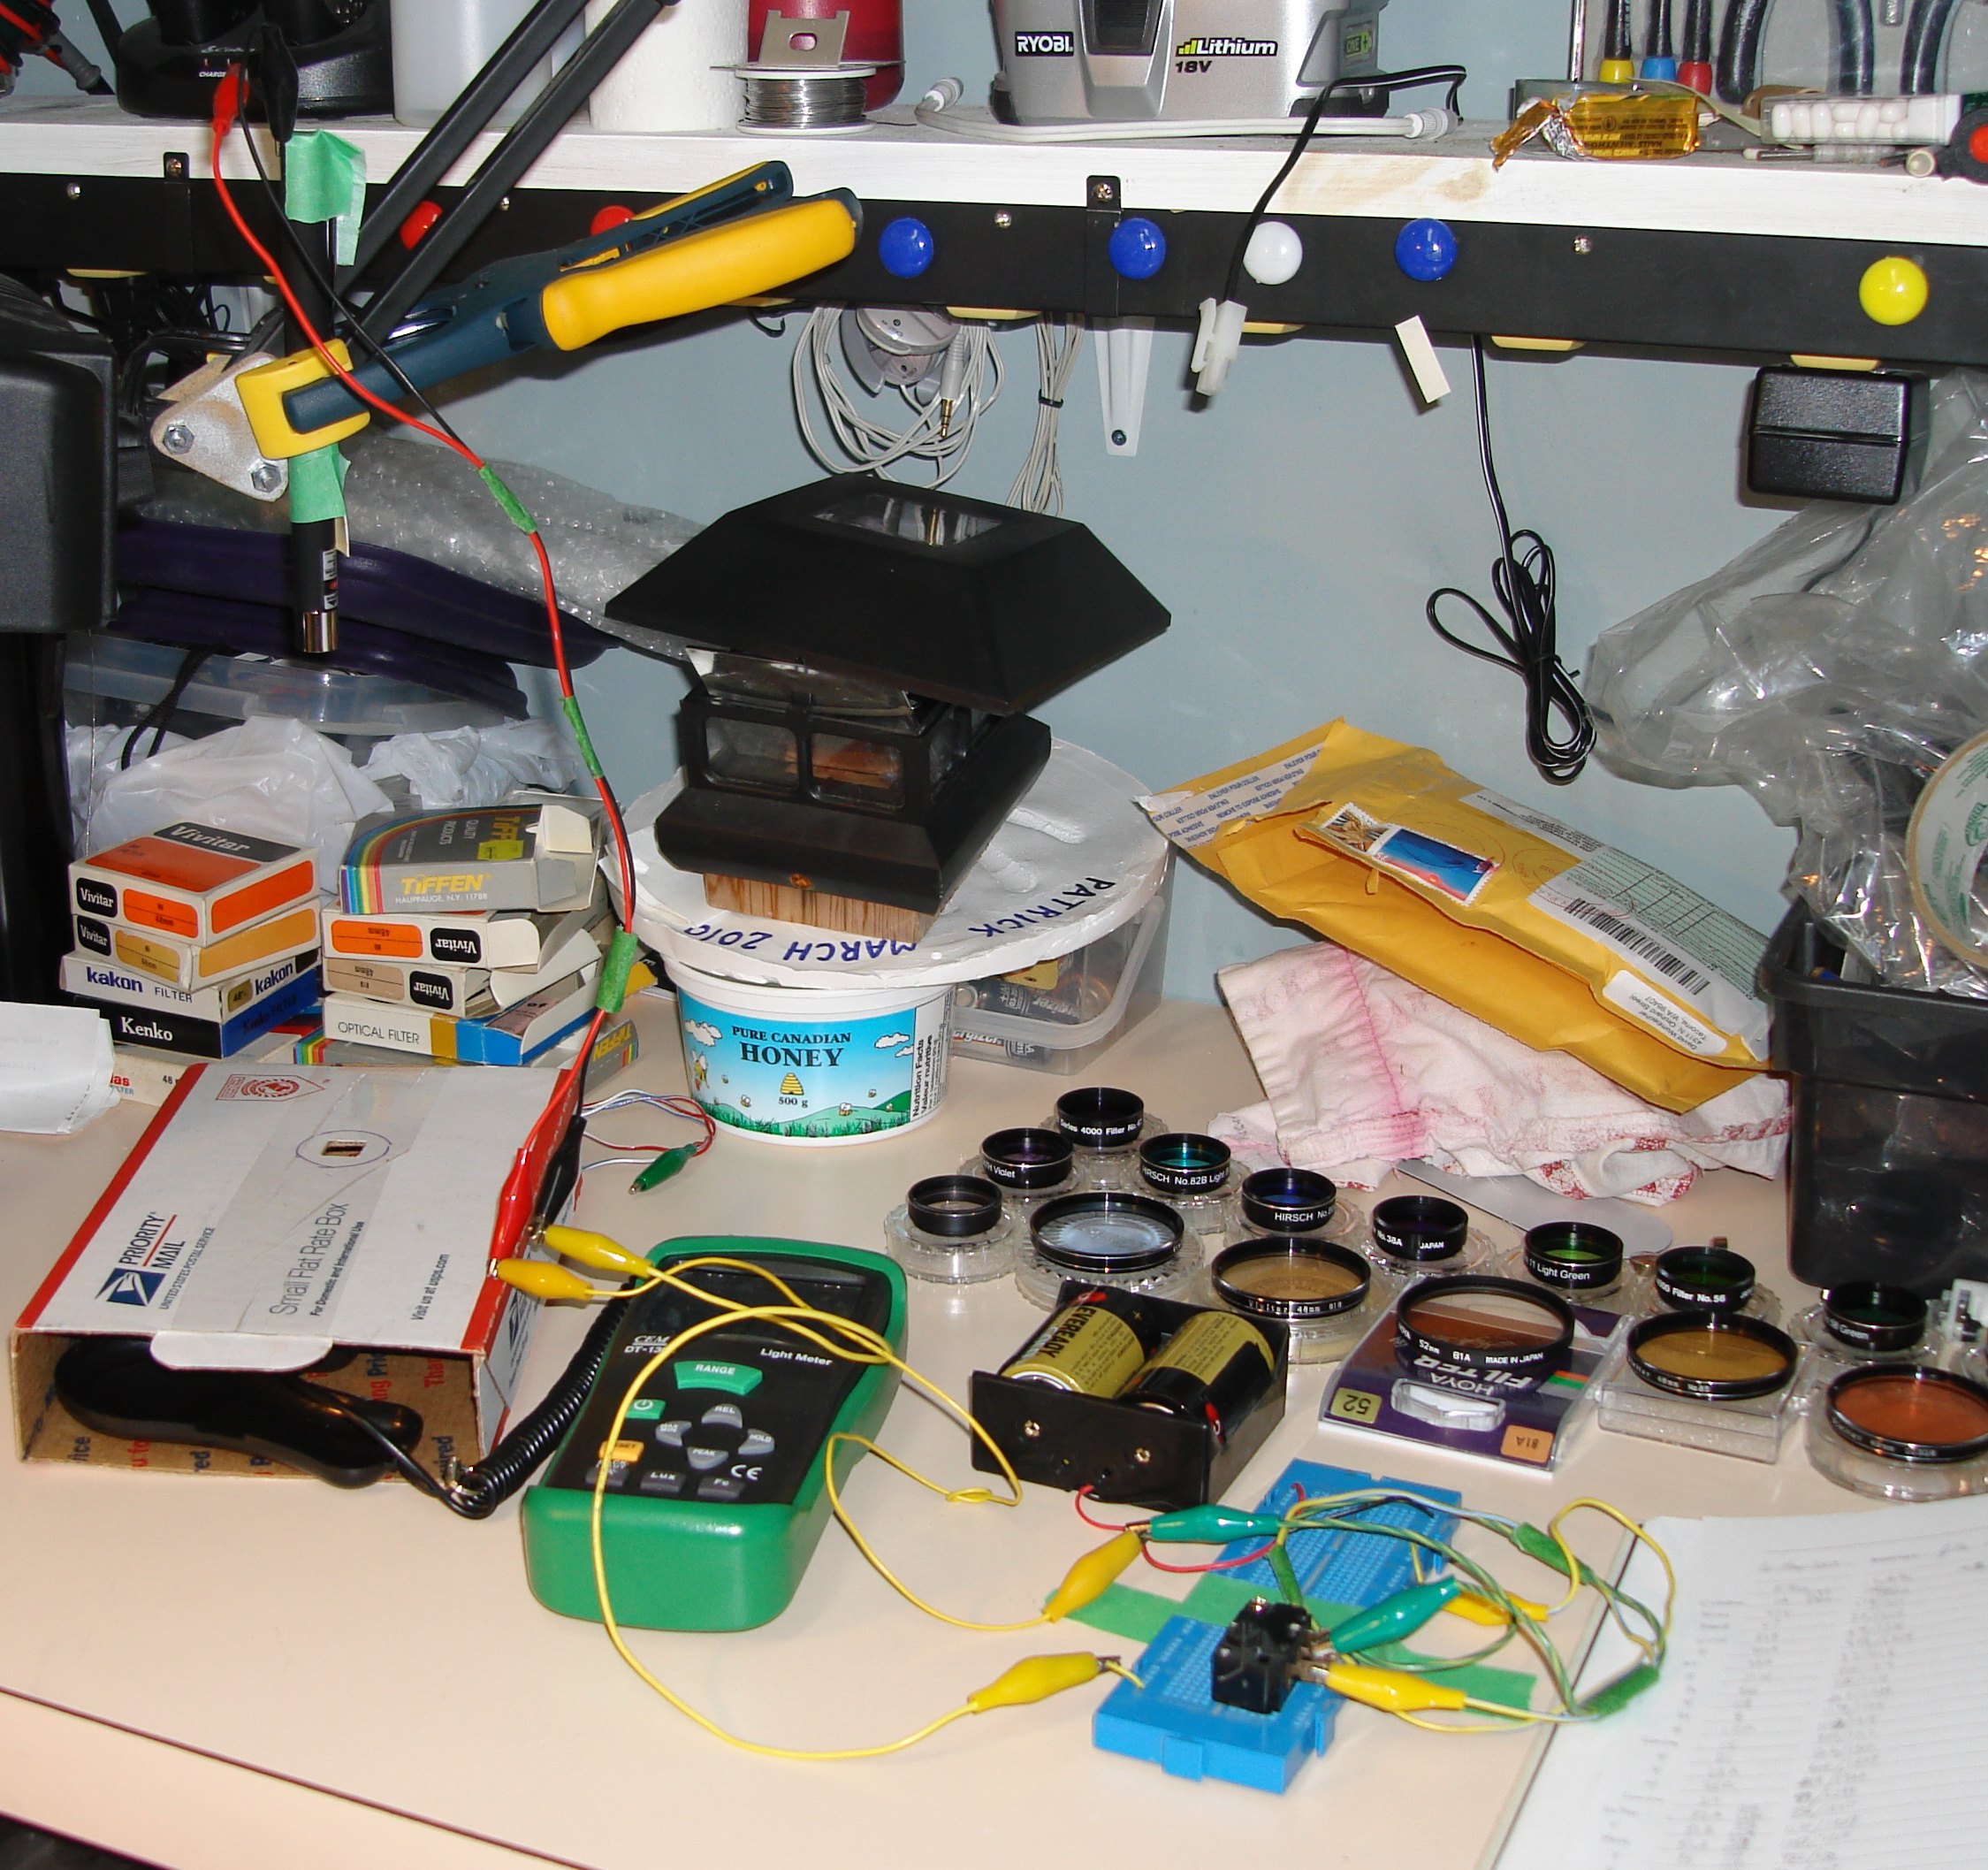
Figure 6 Main Components of My Make-Shift Spectrum Analyser Yes, I did perhaps buy more filters than I will ever use, but I wanted to cover as many of the available colour filters as possible. I purchased one of every available planetary filter colour I could find, from various sources; whatever was the easiest and cheapest source. Some are Hirsch, some Meade, and some Lumicon brands. I have also purchased a number of other common photographic filters that are not available for astronomy but that I thought looked interesting. There is a large number of other Wratten and Colour Compensating filter colours out there, but they are not easily attainable in glass (by "attainable" I mean can be found easily for sale AND sell for a relatively low cost <$15). A visual comparison of the available filter colours can be found in the References chapter. Next I purchased an accurate but reasonably cheap light meter off Ebay. Finally (the kicker) I purchased a series of laser pointers to finish off my half-assed spectrometer, 6 laser pointers in all: purple (405 nm), blue (473 nm), green (532 nm), yellow (589 nm), red (635 nm), and red (650 nm). With the laser pointers plus a normal white light source I was able to measure the photopic transmissivity of each filter plus the response of the filter at each of the six laser wavelengths. I later discovered/realised that my "white" light source, a "daylight" compact flourescent, was not really equivalent to white. I apparently require a specially calibrated lighting standard to measure the photopic transmissivity. Oh well. At least I was able to use the laser data to give me the basic shape of the response curve that I could then use with the Kodak data to come up with the final best guess at the actual spectral response of each colour filter. The basic laser measurement consisted of putting the light sensor inside a box with a 1cm square hole cut in it. Each laser was in turn secured to a support overtop of the box, aiming directly at the light sensor through the hole in the box. I used the peak-hold feature of the light meter to give me the peak Lux value for a 10 second period, with and without the filter in place. I found that the laser pointer output varied up and down over time, so I made a without filter measurement for every with filter measurement. Instead of using batteries in the laser, I hooked it up to an external 3VDC supply with a microswitch, allowing me to switch the laser on and off without changing its aim at the sensor. Filters were centred over the 1cm square hole in the box during a reading.
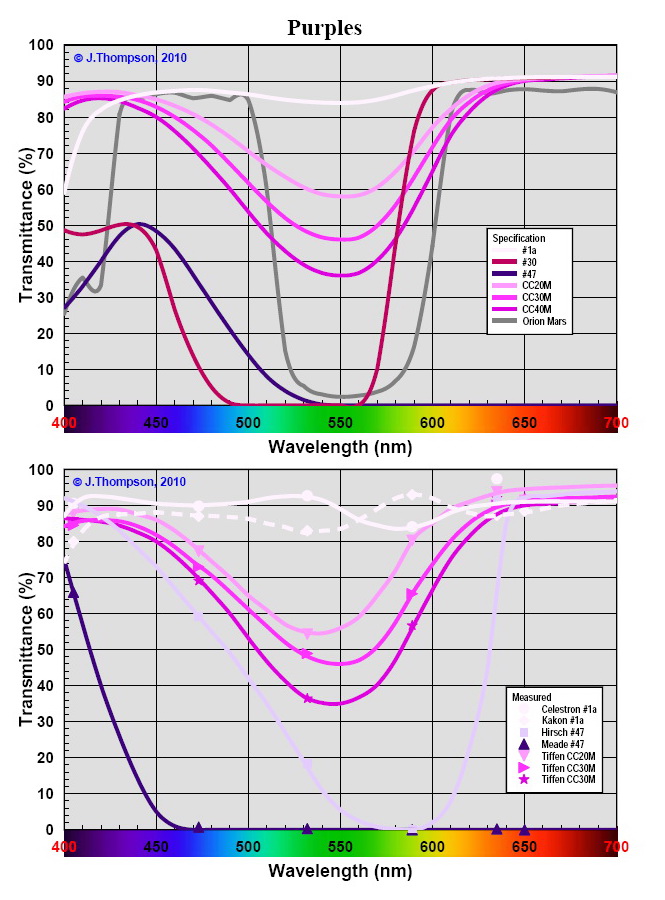
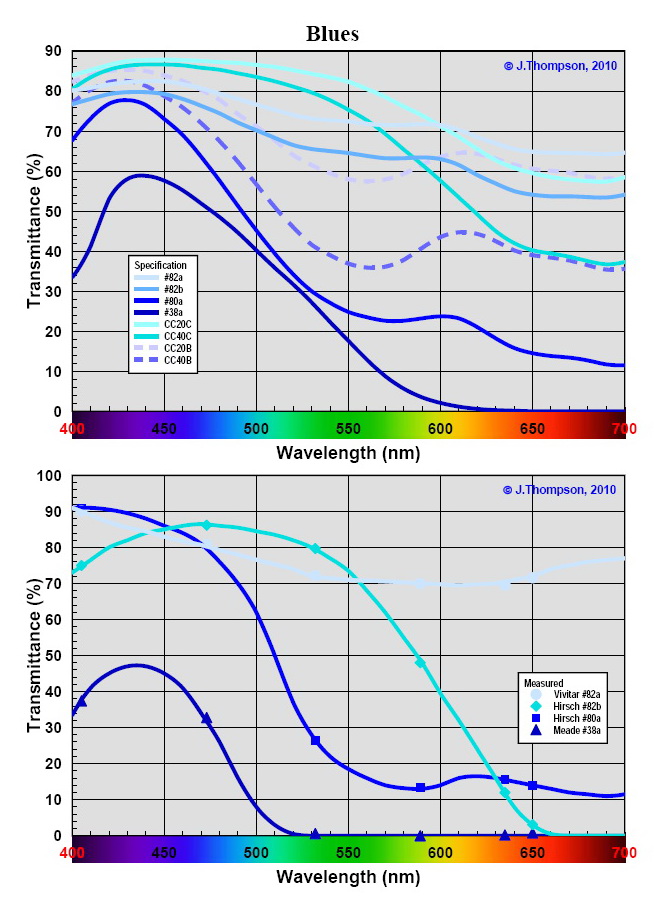
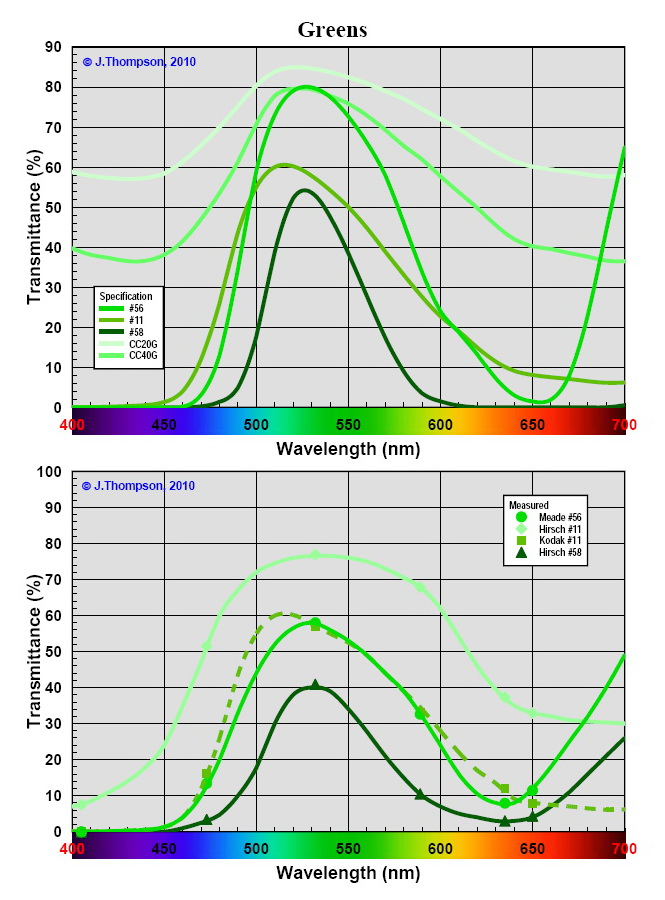
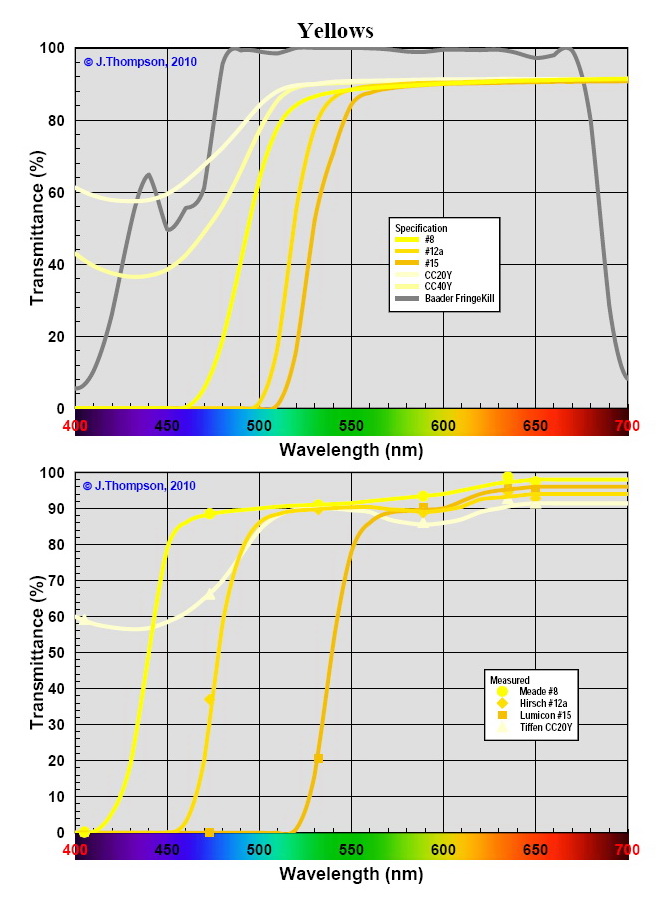
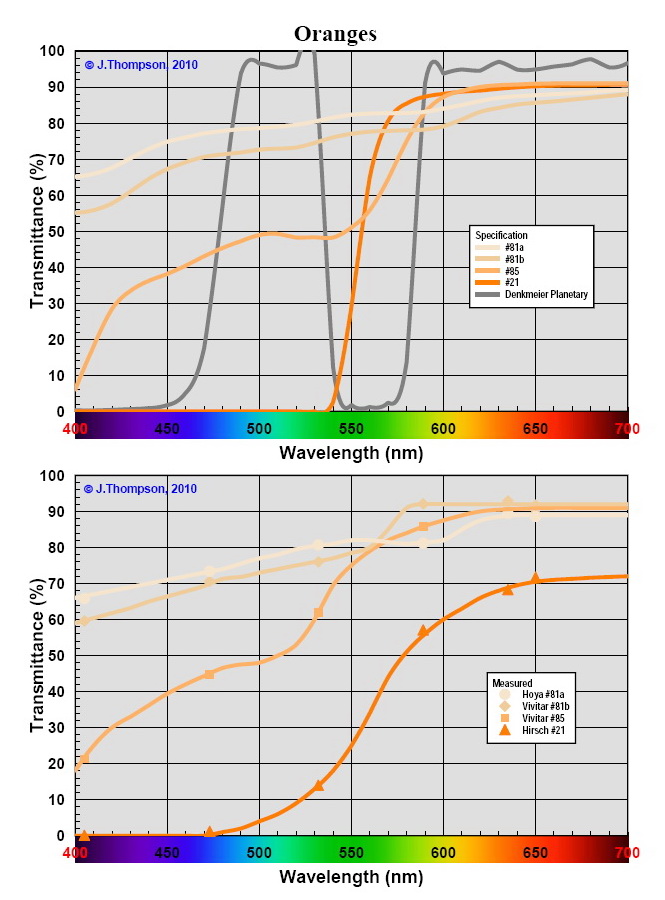
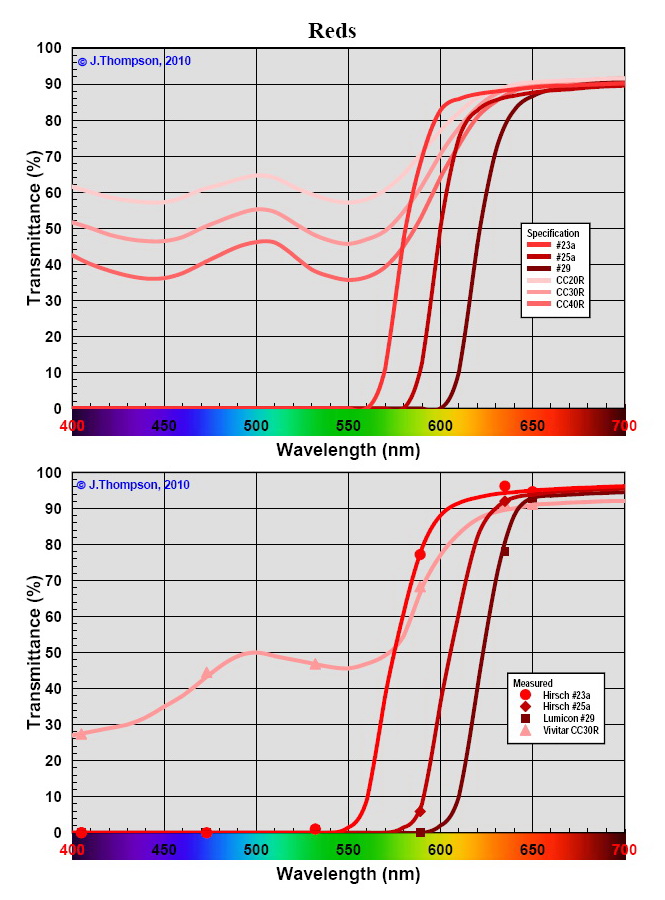
Figure 7 My Spectrum Analyser in Action The results of my measurements, and subsequent curve fitting are shown in the plots below. I added some additional curves out of the Kodak data just for interest sake. I have also added a couple of special filters available for planetary observing: the Orion Mars filter, the Baader Planetarium Fringe Killer, and the Denkmeier Optical Planetary filter (which I think is similar to the Televue Bandmate Mars-A). Additional information on these special filters is covered in the Deep-Sky chapters under the category "Special". There are two graphs on each plot, the upper one shows the spectral responses as specified by Kodak, and the lower one is as I measured it. In some cases there is a big difference between spec and measured, mostly for the astronomy filters. The photography filters were all a pretty good match to the Kodak spec. I have reasonably high confidence in my laser data since I repeated about 25% of my measurement points because I thought they looked incorrect, and for all but a couple got the same measured value. PDF or XLS versions of this data are available upon request.
Figure 8 Colour Filter Spectral Response Curves With the spectral response of each colour filter determined, I was able to calculate the photopic and scotopic transmissivity of each filter. I have summarized this data in Table 1 below, which is also available as a PDF or XLS.
Table 1 Summary of Colour Filter Transmissivities So now that I have this data, what do I do next? Back to the internet… <next>
|
|||||||||||||||||||||||||||||||||||||||||||||||||||||||||||||||||||||||||||||||||||||||||||||||||||||||||||||||||||||||||||||||||||||||||||||||||||||||||||||||||||||||||||||||||||||||||||||||||||||||||||||||||||||||||||||||||||||||||||||||||||||||||||||||||||||||||||||||||||||||||||||||||||||||||||||||||||||||||||||||||||||||||||||||||||||||||||||||||||||||||||||||||||||||||
|
Introduction - The Human Eye - Planetary Filter Research - Using Planetary Filters - Deep-Sky Filter Research - Using Deep-Sky Filters - References |
|||||||||||||||||||||||||||||||||||||||||||||||||||||||||||||||||||||||||||||||||||||||||||||||||||||||||||||||||||||||||||||||||||||||||||||||||||||||||||||||||||||||||||||||||||||||||||||||||||||||||||||||||||||||||||||||||||||||||||||||||||||||||||||||||||||||||||||||||||||||||||||||||||||||||||||||||||||||||||||||||||||||||||||||||||||||||||||||||||||||||||||||||||||||||
Go back to HOMEPAGE
Last updated: 07-Mar-12
|
Copyrights to all content from the webpages hosted here belongs to Jim Thompson. Nov. 2009. |